

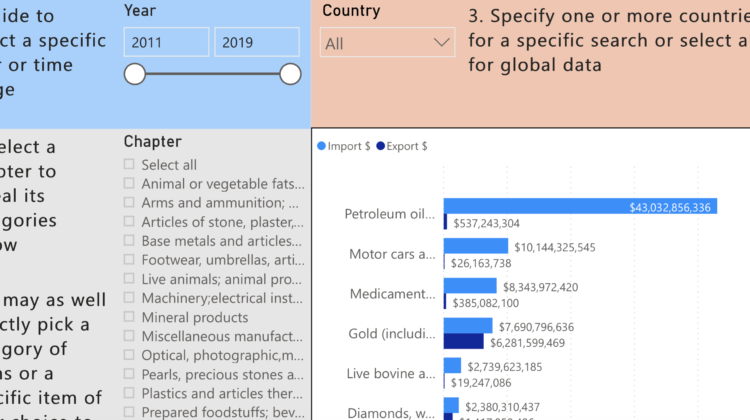
If you’re still wondering why we need that many dollars to import stuff? And why prices of imported items are soaring in recent weeks? Check out this awesome chart created by Bassam Karam grouping all the publicly available customs data from 2011 till 2019.
A couple of insights to give you an idea:
– Did you know that Gold and Diamonds make almost half our exports?
– Did you know that we paid 101 million US dollars to import cakes and biscuits in 2019 alone?
The chart is sorted by country, chapter and category.
↪ Chapters are the main big sets of products
↪ Each “Chapter” has multiple “Categories” under it
↪ Each “Category” is divided into all the “Items” under it.


[vivafbcomment]